Lesson 3 of 6
Find the planets.
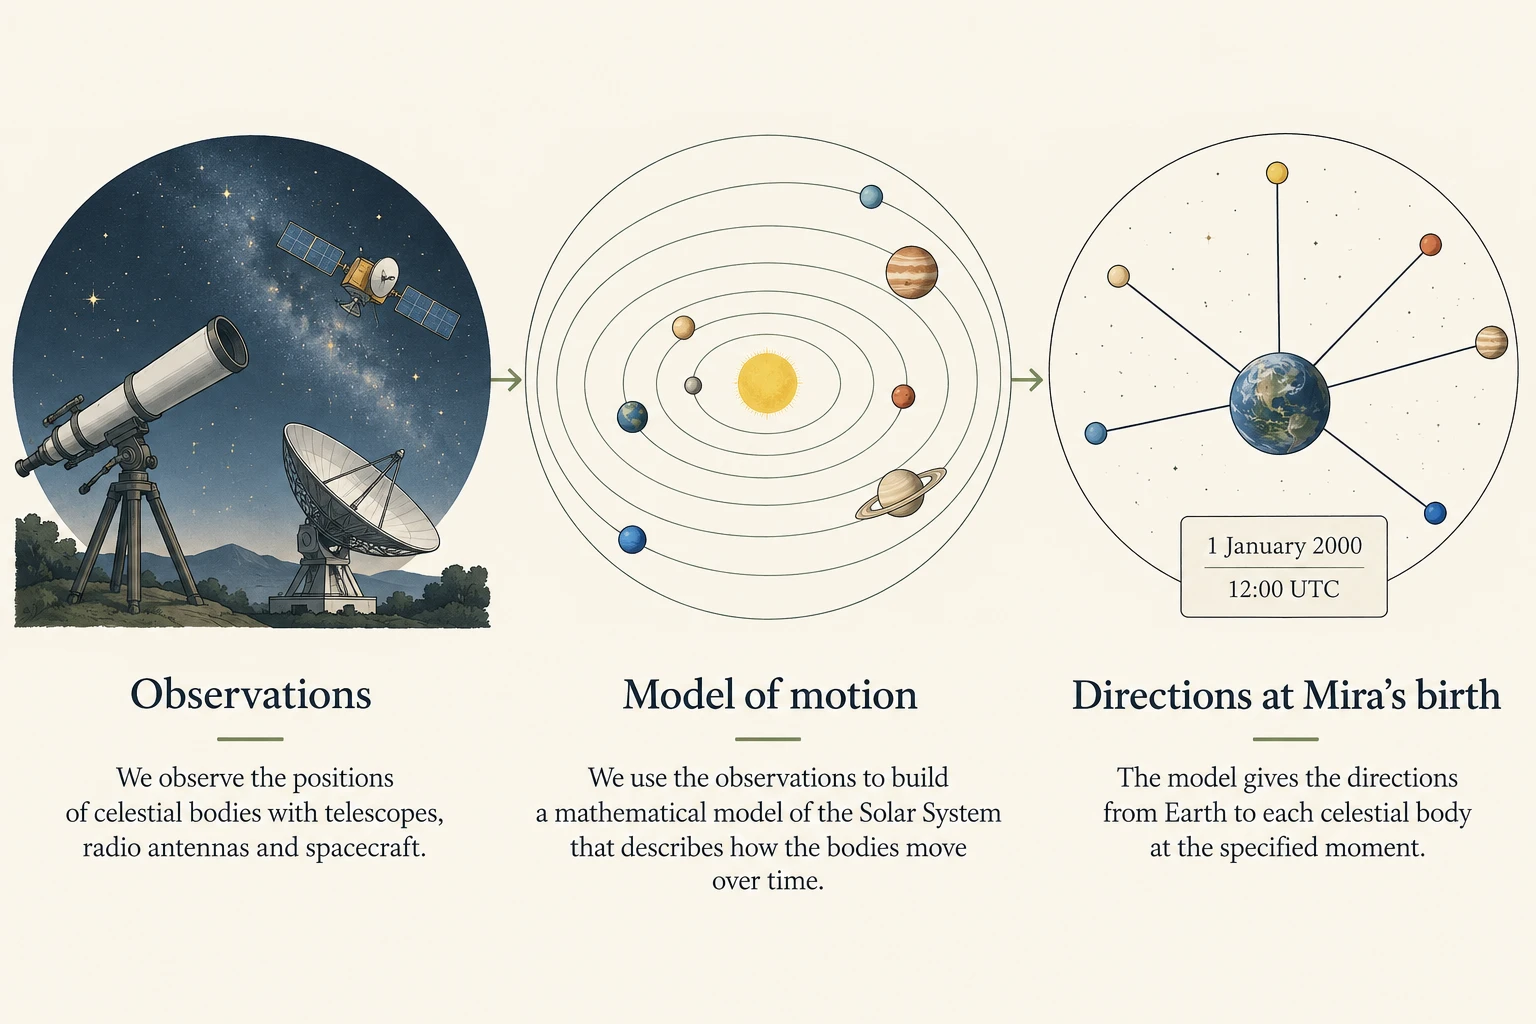
The planets have moved on since Mira’s birth, but we can still calculate their directions for that moment. To do so, we’ll follow the connection between observations of the Solar System and a model that describes its motion.
We can now read a position such as 17° Taurus, but the practice angle from the last lesson does not tell us where any planet was when Mira was born. For that, we need a description of how celestial positions change with time, so we can ask for the directions at 12:00 UTC on 1 January 2000. Such a description is called an ephemeris.
A printed timetable helps us imagine positions recorded at particular times, but Mira’s birth moment might fall between its entries. The ephemeris we use contains a mathematical account of the motion, allowing us to calculate a position within those intervals. We can therefore ask about her exact birth moment rather than choose the nearest daily entry.
Observation gives the calculation something to stand on.
To trust a description of planetary motion, we need a connection to measurements of the Solar System. Our starting point is the DE440 ephemeris from the National Aeronautics and Space Administration’s Jet Propulsion Laboratory, usually shortened to NASA’s JPL. Its calculated orbits were fitted to measurements from Earth and spacecraft, including tracking of Juno that helped refine Jupiter’s orbit and of Cassini that helped refine Saturn’s. Those distant missions contribute to the positions we can calculate here.
Ryan Park and colleagues’ account of DE440 explains how these observations and the model were brought together. For Mira’s chart, we use that work to obtain astronomical directions. The meanings assigned to chart symbols are a separate subject, outside this course.
Behind the predictions: a calculation gave Neptune’s observers somewhere to look
In the nineteenth century, Uranus was not following quite the path predicted for it. Urbain Le Verrier and John Couch Adams independently explored whether another planet’s gravity could explain the difference. Le Verrier sent a predicted location to Berlin, and in September 1846 Johann Galle found Neptune close to it.
The calculation gave a telescope somewhere to look, while the observation supplied evidence for what had been predicted. Our task with Mira’s chart is smaller, but it draws on the same partnership: observations constrain a model, and the model gives us positions that can be checked.
The discovery of Neptune · National Aeronautics and Space Administration
Bring the viewpoint home.
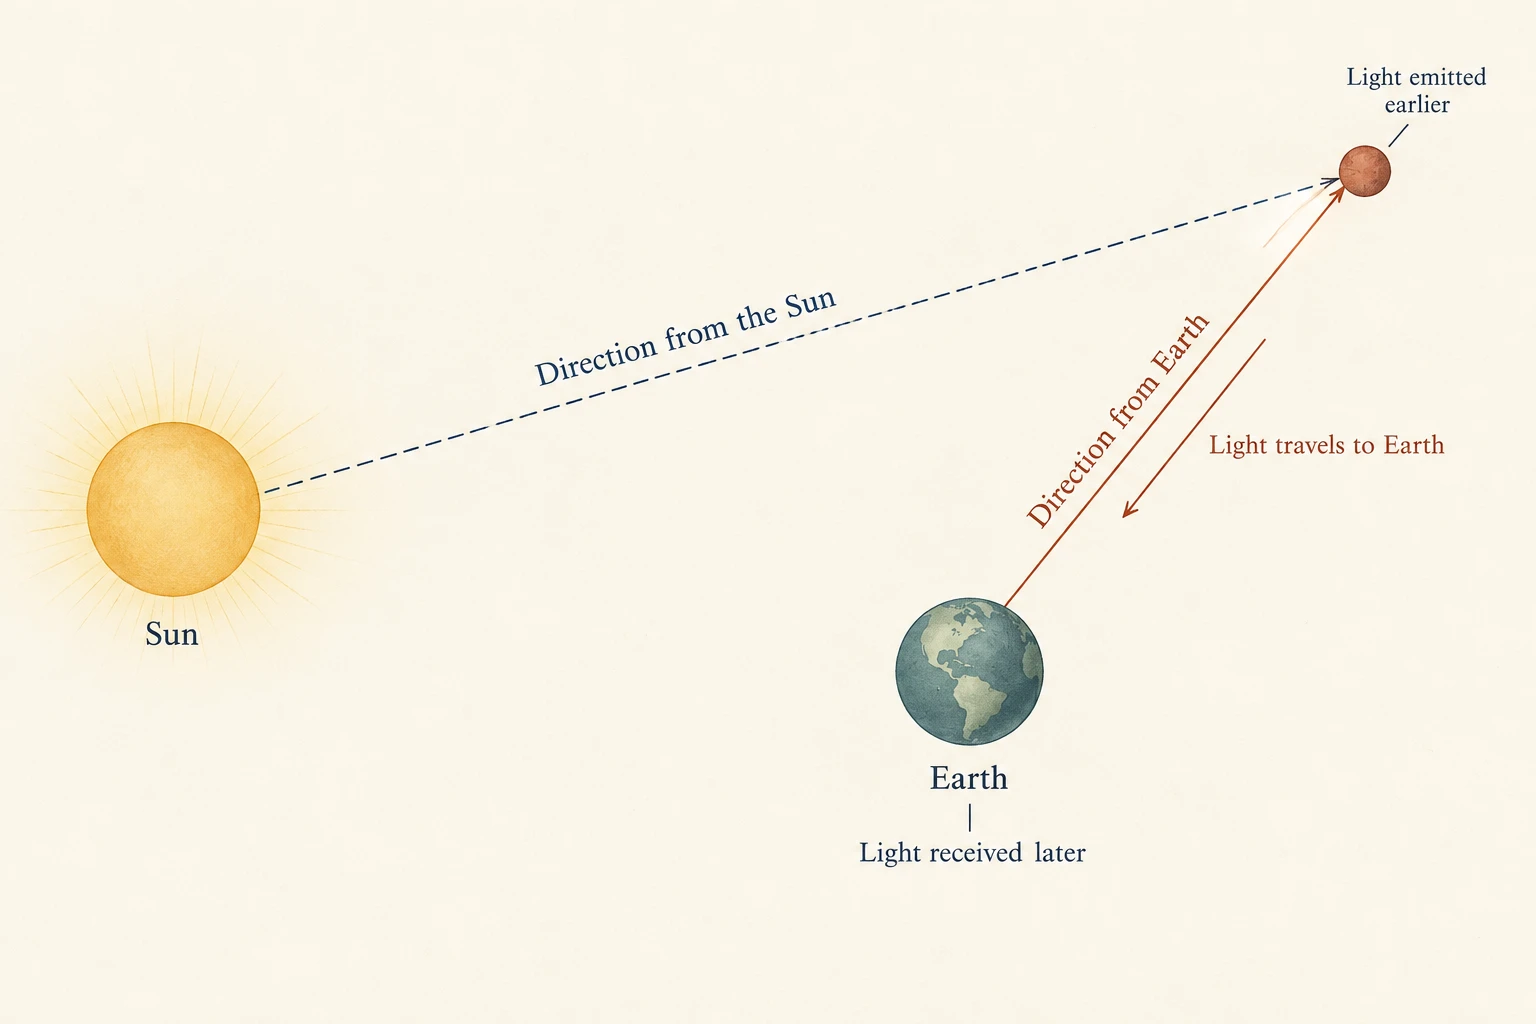
An orbit model describes where bodies are, but we still need to choose the viewpoint from which we will read their directions. For Mira’s planetary chart, we use the centre of Earth. When the ephemeris data is prepared, the source positions are converted into apparent directions from that viewpoint, accounting for effects such as the time light takes to reach us and expressing the result in the sky coordinates we need.
A direction measured from the Sun would answer a different question: we want to know where the planet appears from Earth. Using Earth’s centre as the viewpoint makes this a geocentric chart. As we established in the first lesson, Mira’s London location will contribute her local horizon later; the planetary positions at this stage use the shared Earth-centred viewpoint.
A curve we can carry with us.
To find a position at Mira’s birth moment, we first locate the short interval of prepared data that contains it. Each interval has a mathematical curve describing the motion, so we can calculate a value at the relevant point along that curve. The prepared ephemeris represents these curves using Chebyshev polynomials, which combine numerical coefficients with functions of a variable describing where we are within the interval.
We do not need to construct the curves ourselves to make a chart. The library selects the interval and evaluates its curve for the birth moment, obtaining a longitude between the sample times from data already prepared. A small invented example below lets us see what evaluating a curve means before we use the full calculation.
longitude = 120 + 2x
In this invented four-day interval, x describes how far through the time span we are: x = −1 at the start and +1 at the end. Halfway through, x = 0, so multiplying by 2 adds nothing to 120° and the result is 120°. At two and a half days, x = 0.25; multiplying 2 × 0.25 gives 0.5, then adding it gives 120 + 0.5 = 120.5°. These are teaching values, rather than positions calculated for Mira.
A small model
Between the entries.
Imagine a simple four-day stretch of motion, from 118° to 122°. These are invented tropical longitudes, chosen to make the arithmetic easy.
120 + 2 × (0.250) = 120.50°
Here x runs from −1 at the start to +1 at the end. A real ephemeris uses more terms to follow a curved path. This display teaches evaluation; it is not a planet prediction.
Read the result against the stars.
The prepared planetary longitudes use the equinox as their starting direction, so we now apply the change of reference we practised in the previous lesson. The calculation finds the Fagan–Bradley ayanamsa for the birth date, subtracts that offset and wraps the answer into one turn. We can then read the resulting sidereal longitude as a sign and a degree within it. For Mira, this uses her date’s calculated offset rather than our earlier invented 24°.
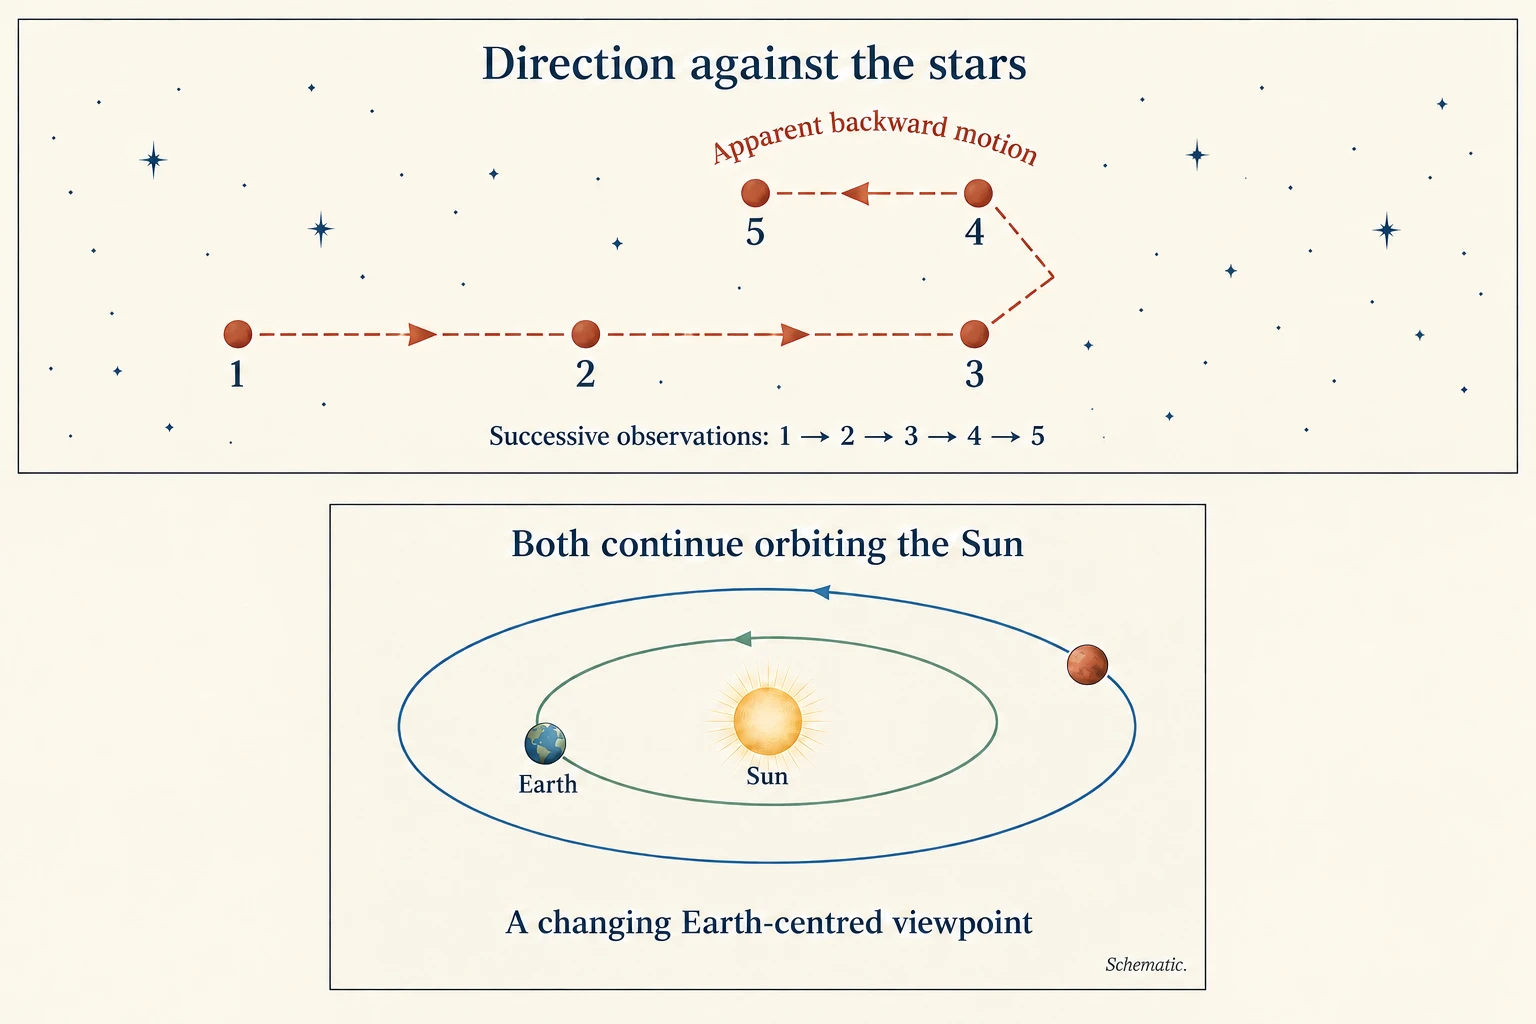
Alongside a planet’s direction, we can ask how that direction is changing with time. When its longitude is decreasing, we describe the apparent motion as retrograde. The decrease is measured in our chosen Earth-centred coordinates; it does not mean the planet has reversed its orbit around the Sun. To estimate the daily change at the birth moment, the library compares positions half a day before and half a day after it.
We are ready to calculate the planetary positions for Mira’s birth, or for the record you entered in the first lesson. The first request loads the prepared ephemeris into this tab, so it may take longer than later requests that reuse the data. Your birth details stay here. Once the results appear, try reading their sign addresses using the circle arithmetic we have practised.
Your sky, calculated
2000-01-01 at 12:00 UTC · 51.5° latitude, -0.12° longitude
Change birth details
Your turn
Choose your moment.
Use your own birth details, or follow Mira. Enter the date and time in UTC, including any change of date when converting from local time.
2000-01-01 at 12:00 UTC · 51.5° latitude, -0.12° longitude
Saved birth details stay in this browser when you reload or return. Use Mira’s example to clear your saved record. No birth details are sent anywhere. Planet calculations arrive in a later lesson.
Each calculation loads only the sky data needed for your birth year, usually less than 100 KB, alongside the calculator. Saved birth details stay in this browser for your next visit.
Make it yours
Try the idea.
A few questions to put the pieces together. Take your time; you can try again.
The sky has positions. It still needs a horizon.
We now have planetary directions for the birth moment and a way to read them on the sidereal zodiac. To make the chart local to Mira’s birth, our next question is which part of that zodiac was rising above London’s eastern horizon. That brings her birthplace back into the calculation.